

Blue Bulletin
Majors Industries
March 2026

Natural gas market conditions
Seasonal dynamics
The winter of 2025–2026 has proven particularly volatile, marked by a rapid alternation between cold spells and thaws that have significantly affected the North American gas balance. In December, an early cold snap increased demand for Ontario inventory sooner than usual. However, subsequent warm spells helped stabilize inventory levels, which remained adequate in both Canada and the United States, close to seasonal averages.
The situation changed abruptly in late January with the arrival of the polar vortex, which brought persistent and exceptionally cold temperatures. On the supply side, the extreme conditions led to significant well freeze-offs, reducing U.S. production by as much as 15%.2 This rapid contraction in supply coincided with a sustained increase in demand driven by higher heating needs, placing additional pressure on transportation infrastructure and storage systems.
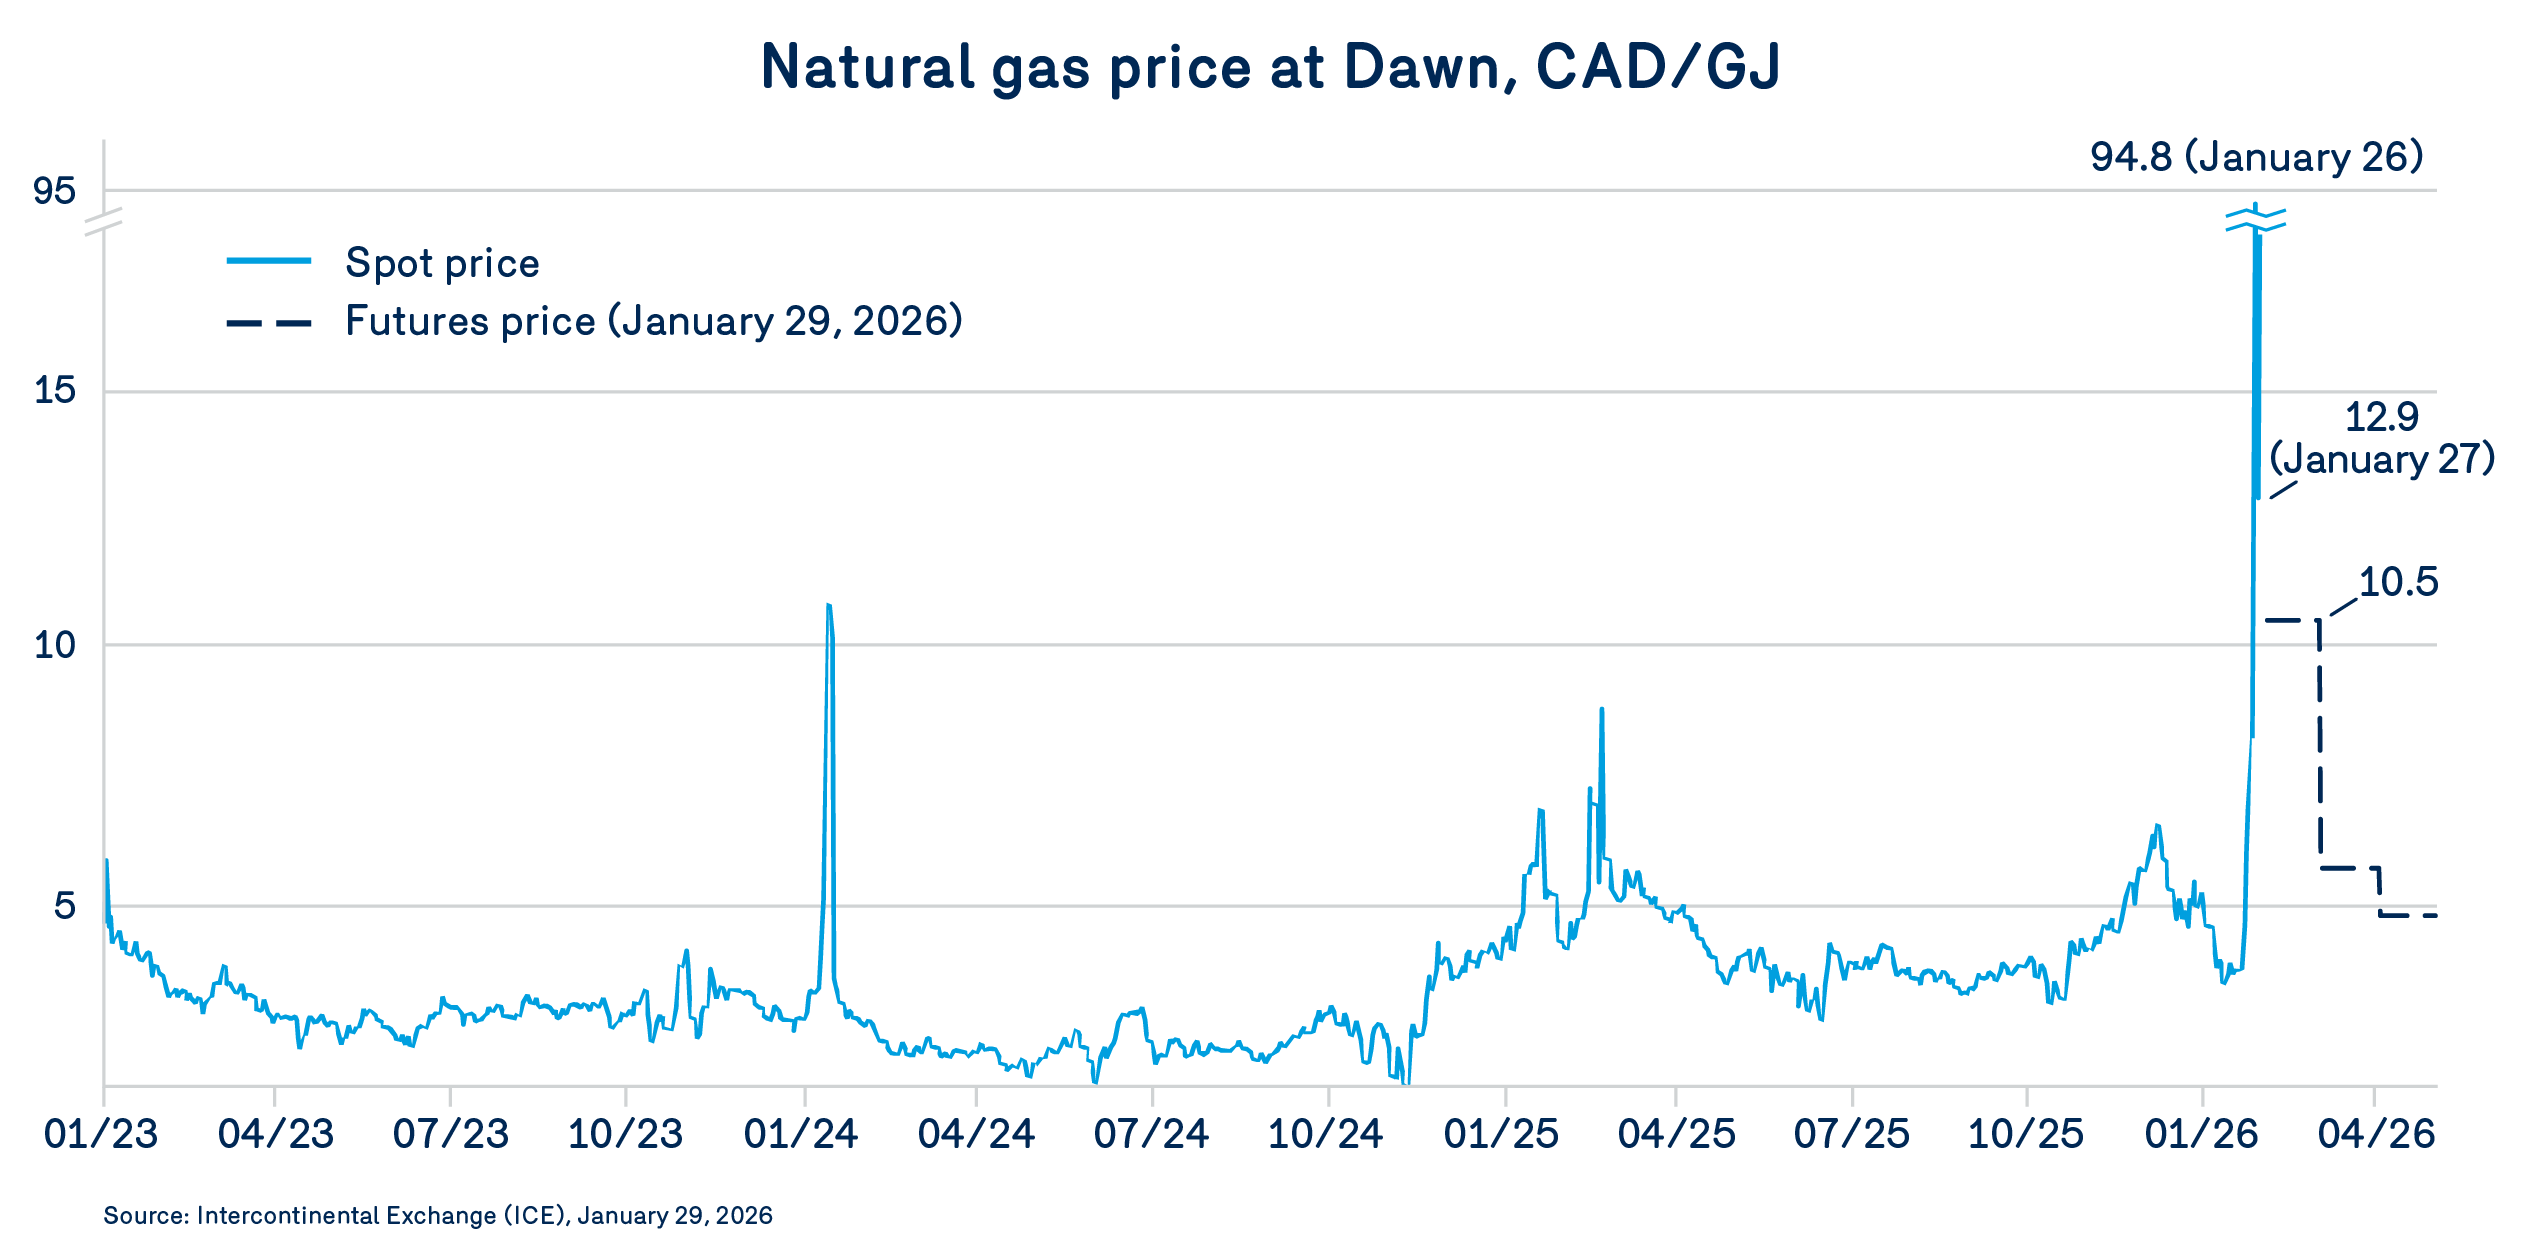
In this context of heightened tension, spot prices reacted dramatically. At the Dawn Hub, a historic peak was reached on January 26, when the spot price exceeded $90/GJ. While this extreme level was short-lived, the underlying conditions persist, and projections suggest that prices could remain above $10/GJ until March.
This behaviour reflects Dawn’s sensitivity to dynamics in the U.S. Midwest and Northeast, where the combination of strong demand and heavily utilized transportation capacity can quickly create situations of marginal scarcity.
In contrast, prices at Empress remained much more moderate. Although a brief peak of $27/GJ was observed on January 26, the market quickly returned to its usual levels of around $3.33/GJ on January 28.
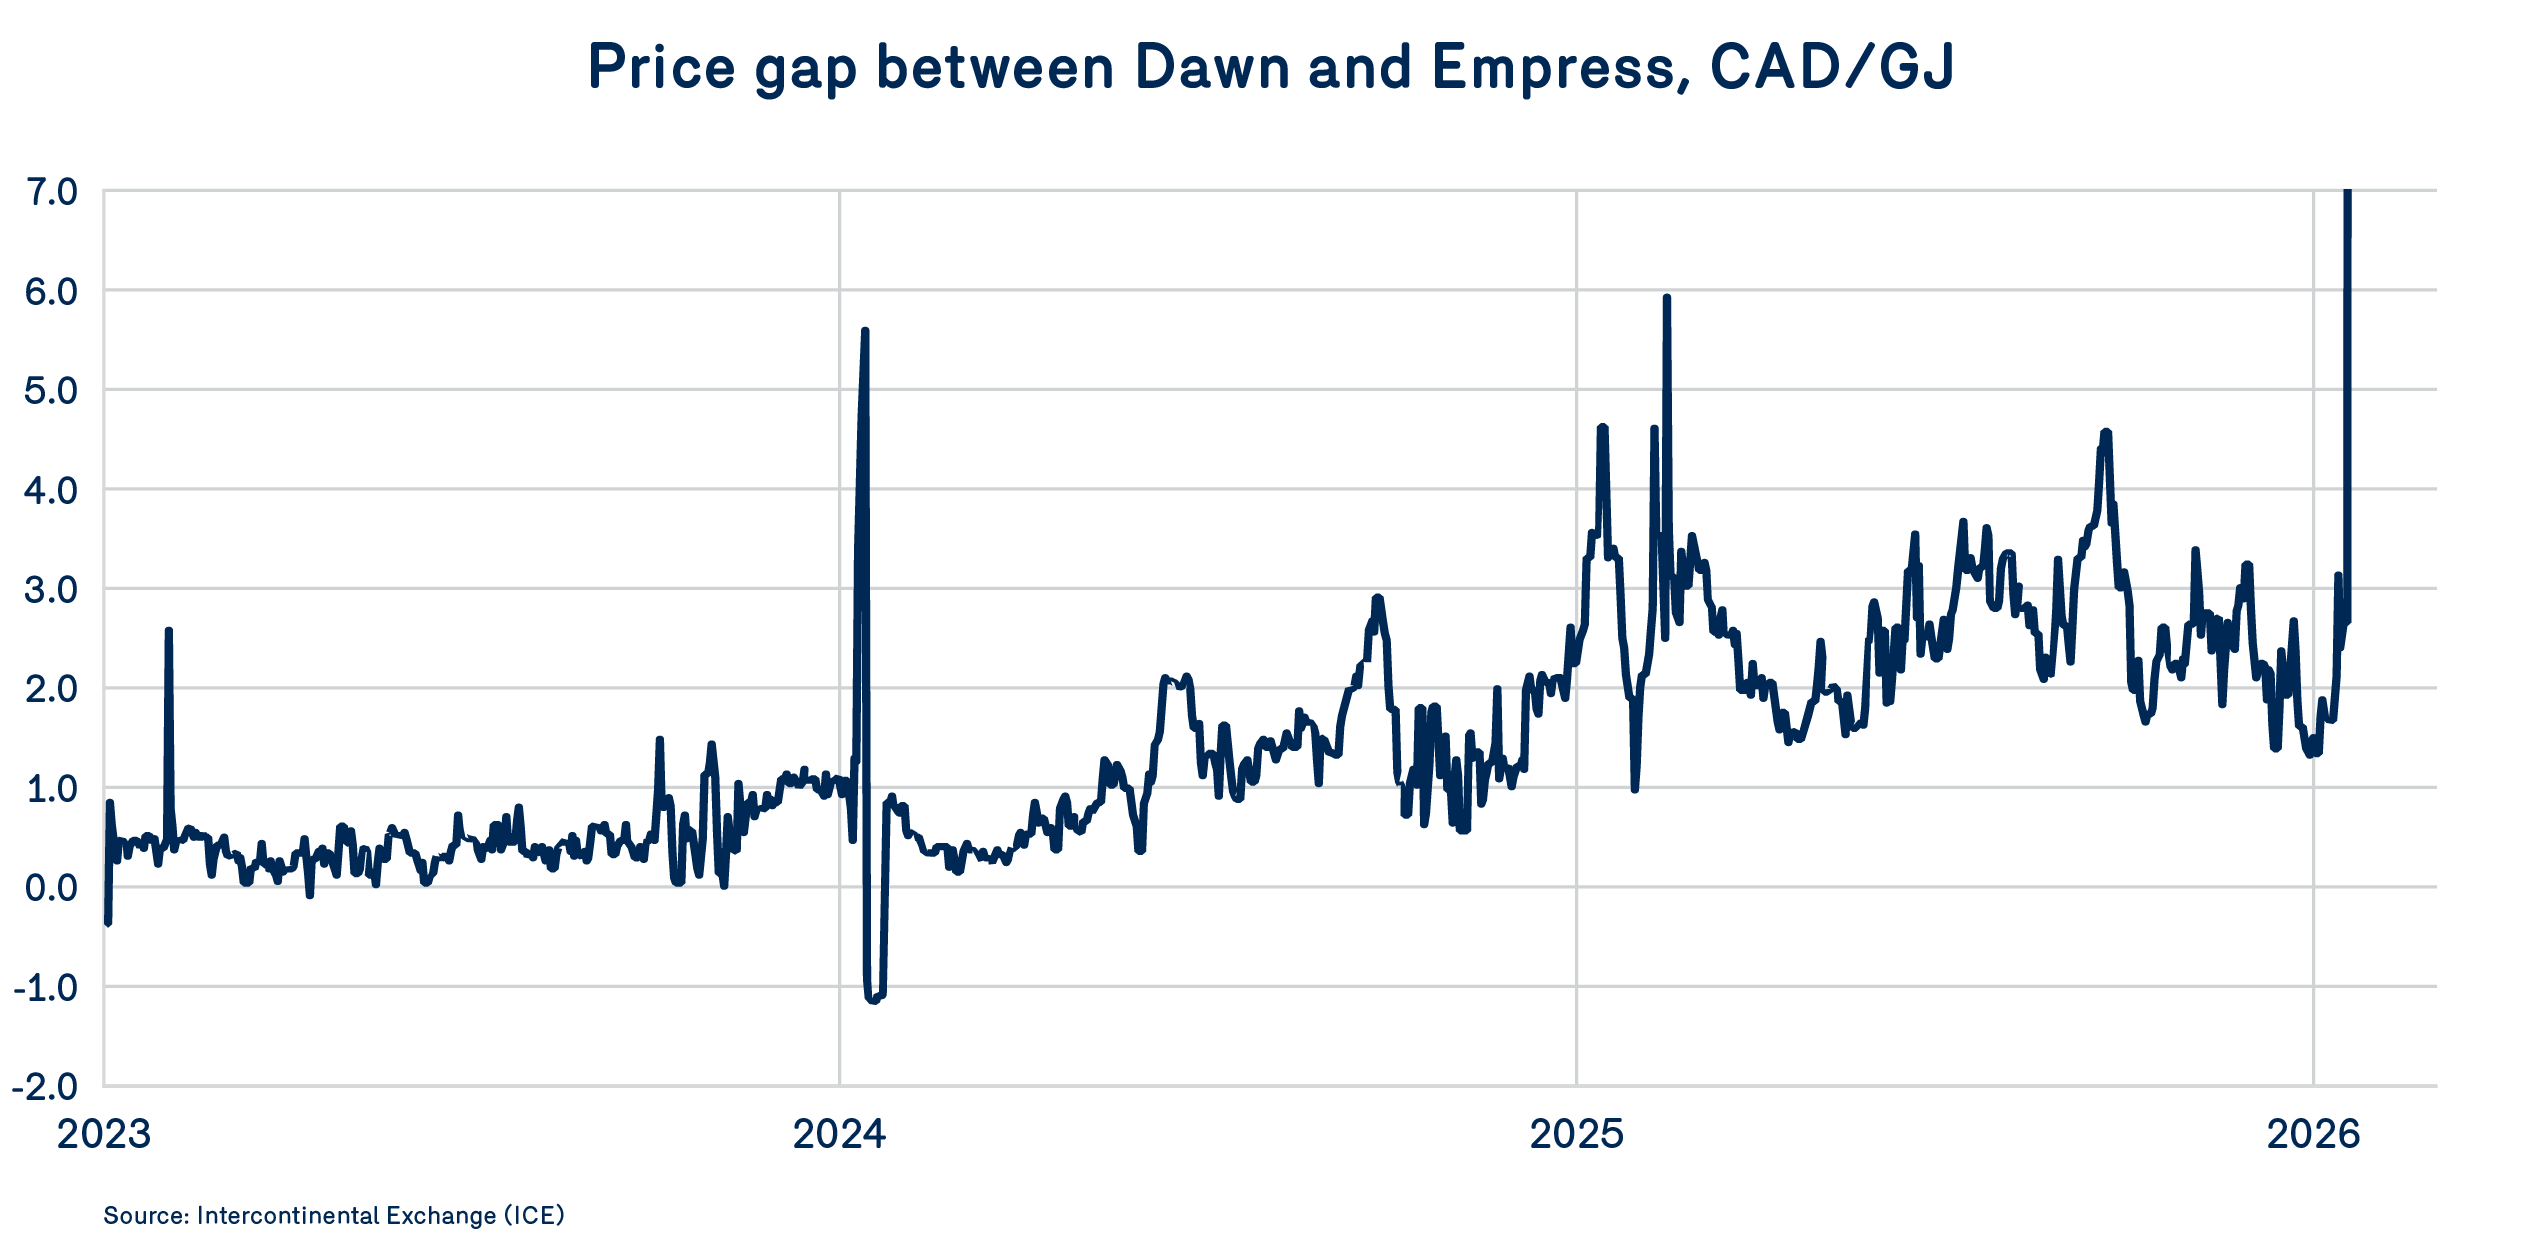
The sharp widening of the Dawn-Empress differential reflects a persistent structural reality: insufficient transportation capacity to move gas efficiently from production regions to markets more exposed to winter demand. This phenomenon is amplified during extreme events, when constraints on certain U.S. corridors—combined with potential physical network limitations—further increase regional price spreads.
Overall, the current winter highlights the vulnerability of the North American gas system to extreme weather fluctuations and infrastructure constraints. In the short term, conditions remain conducive to continued volatility, particularly if additional cold waves increase demand or disrupt supply flows.
2030 Outlook2
North American market
developments
UNITED STATES | CANADA | |
| Demande 2023 | 133.5 billion cubic feet /day, + 18% compared with 2025 | 22.2 billion cubic feet /day, + 14% compared with 2025 |
| Production 2030 | 127.4 billion cubic feet /day, + 24% compared with 2025 | 22.2 billion cubic feet /day, + 17% compared with 2025 |
Markets drivers
1
Demand
2
Production
3
Transportation
4
LNG
In the United States, LNG exports are expected to account for 74% of demand growth by 2030, while exports to Mexico will also contribute to rising demand. Demand in the power generation sector is expected to decline temporarily between 2025 (35.8 billion cubic feet/day) and 2028 (34.1 billion cubic feet/day) due to delays in coal plant retirements, before increasing again—due in part to growing demand from data centres—to reach 38.6 billion cubic feet/day in 2030.
In Canada, demand growth is mainly driven by LNG export projects in British Columbia. LNG demand is expected to reach 2.9 billion cubic feet/day in 2030, compared with 0.3 billion cubic feet/day in 2025.
Production growth in the United States is mainly supported by the Permian Basin, which has a high gas-to-oil ratio, as well as by Haynesville, which benefits from access to the Gulf Coast via Texas Gateway to meet rising LNG demand.
In Canada, production is expected to increase by 3.3 billion cubic feet/day by 2030 compared with 2025 levels, primarily to meet LNG demand.
Infrastructure constraints in the U.S. Northeast could be partially alleviated after 2028, when projects such as Transco SSE and MVP Southgate become fully operational and contribute to supply growth.
No additional export capacity is expected in western Canada by 2030.
The development of LNG export infrastructure in the United States continues to accelerate. Exports are projected to reach 31.5 billion cubic feet/day in 2030, an increase of roughly 90% compared with 2025.
In Canada, Woodfibre LNG is still expected to be the next export facility to be commissioned, scheduled for August 2027. It will be a much smaller facility than LNG Canada, with an approximate capacity of 300 million cubic feet/day.
1
Demand
In the United States, LNG exports are expected to account for 74% of demand growth by 2030, while exports to Mexico will also contribute to rising demand. Demand in the power generation sector is expected to decline temporarily between 2025 (35.8 billion cubic feet/day) and 2028 (34.1 billion cubic feet/day) due to delays in coal plant retirements, before increasing again—due in part to growing demand from data centres—to reach 38.6 billion cubic feet/day in 2030.
In Canada, demand growth is mainly driven by LNG export projects in British Columbia. LNG demand is expected to reach 2.9 billion cubic feet/day in 2030, compared with 0.3 billion cubic feet/day in 2025.
2
Production
Production growth in the United States is mainly supported by the Permian Basin, which has a high gas-to-oil ratio, as well as by Haynesville, which benefits from access to the Gulf Coast via Texas Gateway to meet rising LNG demand.
In Canada, production is expected to increase by 3.3 billion cubic feet/day by 2030 compared with 2025 levels, primarily to meet LNG demand.
3
Transportation
Infrastructure constraints in the U.S. Northeast could be partially alleviated after 2028, when projects such as Transco SSE and MVP Southgate become fully operational and contribute to supply growth.
No additional export capacity is expected in western Canada by 2030.
4
LNG
The development of LNG export infrastructure in the United States continues to accelerate. Exports are projected to reach 31.5 billion cubic feet/day in 2030, an increase of roughly 90% compared with 2025.
In Canada, Woodfibre LNG is still expected to be the next export facility to be commissioned, scheduled for August 2027. It will be a much smaller facility than LNG Canada, with an approximate capacity of 300 million cubic feet/day.
1. Financial Content, “Arctic Blast Paralyzes U.S. Natural Gas Markets: Henry Hub Prices Rocket 50% Amid Production Freeze-Offs”
2. Source: S&P Global Energy